Quetta
A discursive design project on the impact of the Internet on the environment
Mingzhu Fan, Bram Willems, Tessa van Abkoude, Marc Wijkmans
My team and I explored the inherently abstract and sometimes unfathomable nature of the Internet. More specifically, we aimed to unveil the hidden but existing negative impact of the internet and the growing importance of online data on climate change. Through a discursive design approach, we designed Quetta, an exhibition that stimulates conversation and makes the internet and its impact on the environment less abstract and more understandable. It consists of three exhibits. These are: (a) WiFinder; a device that can detect Wi-Fi strength and translates it into sound, vibration, and light. (b) Shop your data; a product where you can input your data usage for a day and receive a receipt about the environmental impact it has. ( c ) An Infographic poster that illustrated the complex infrastructure of the internet.
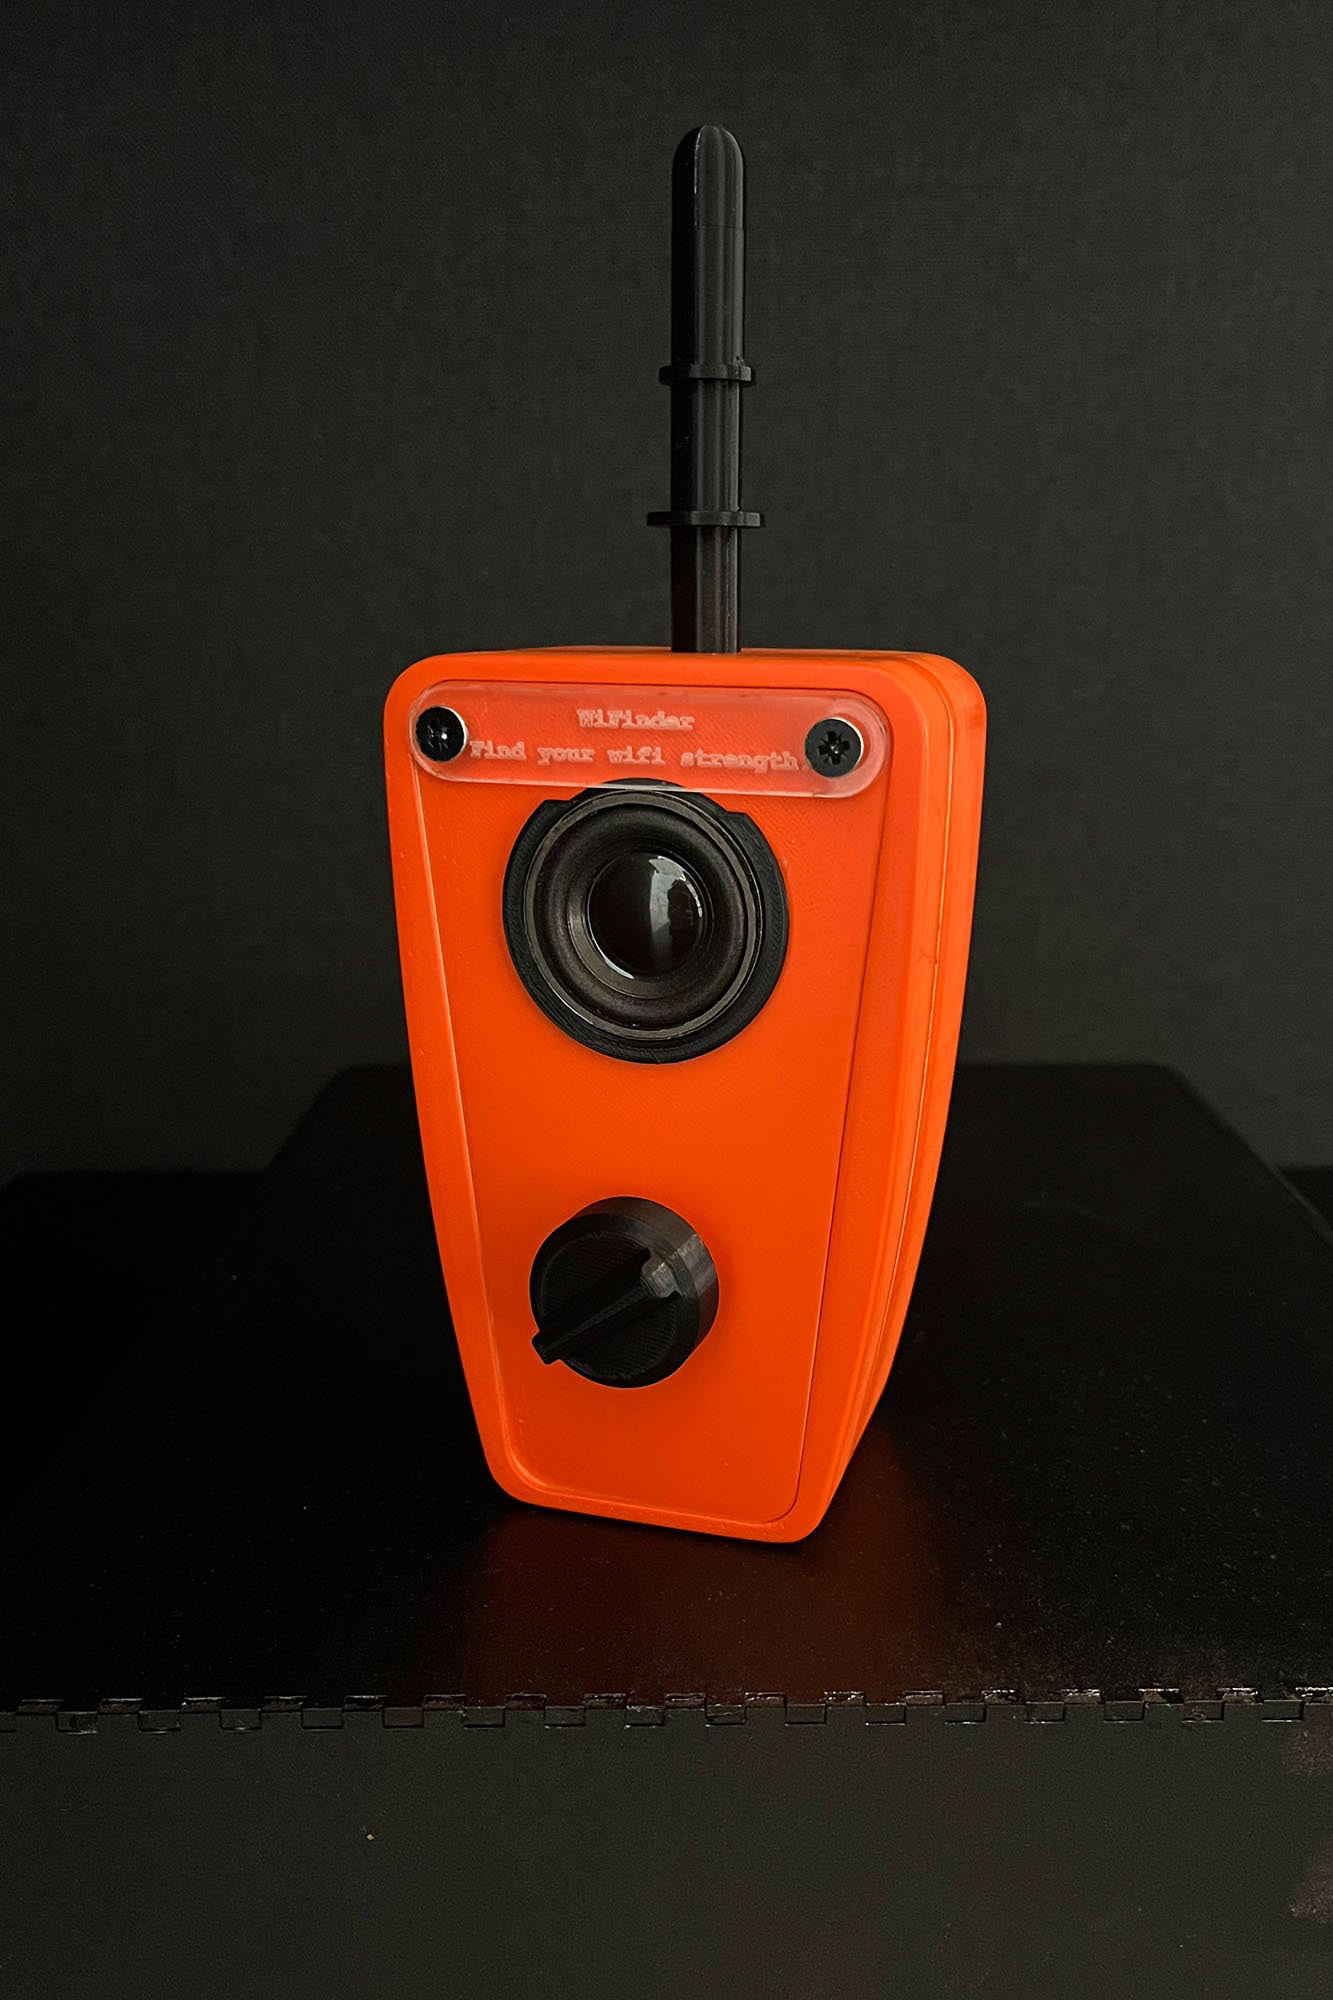
Exhibit 1 > WiFInder - T&R, MD&C
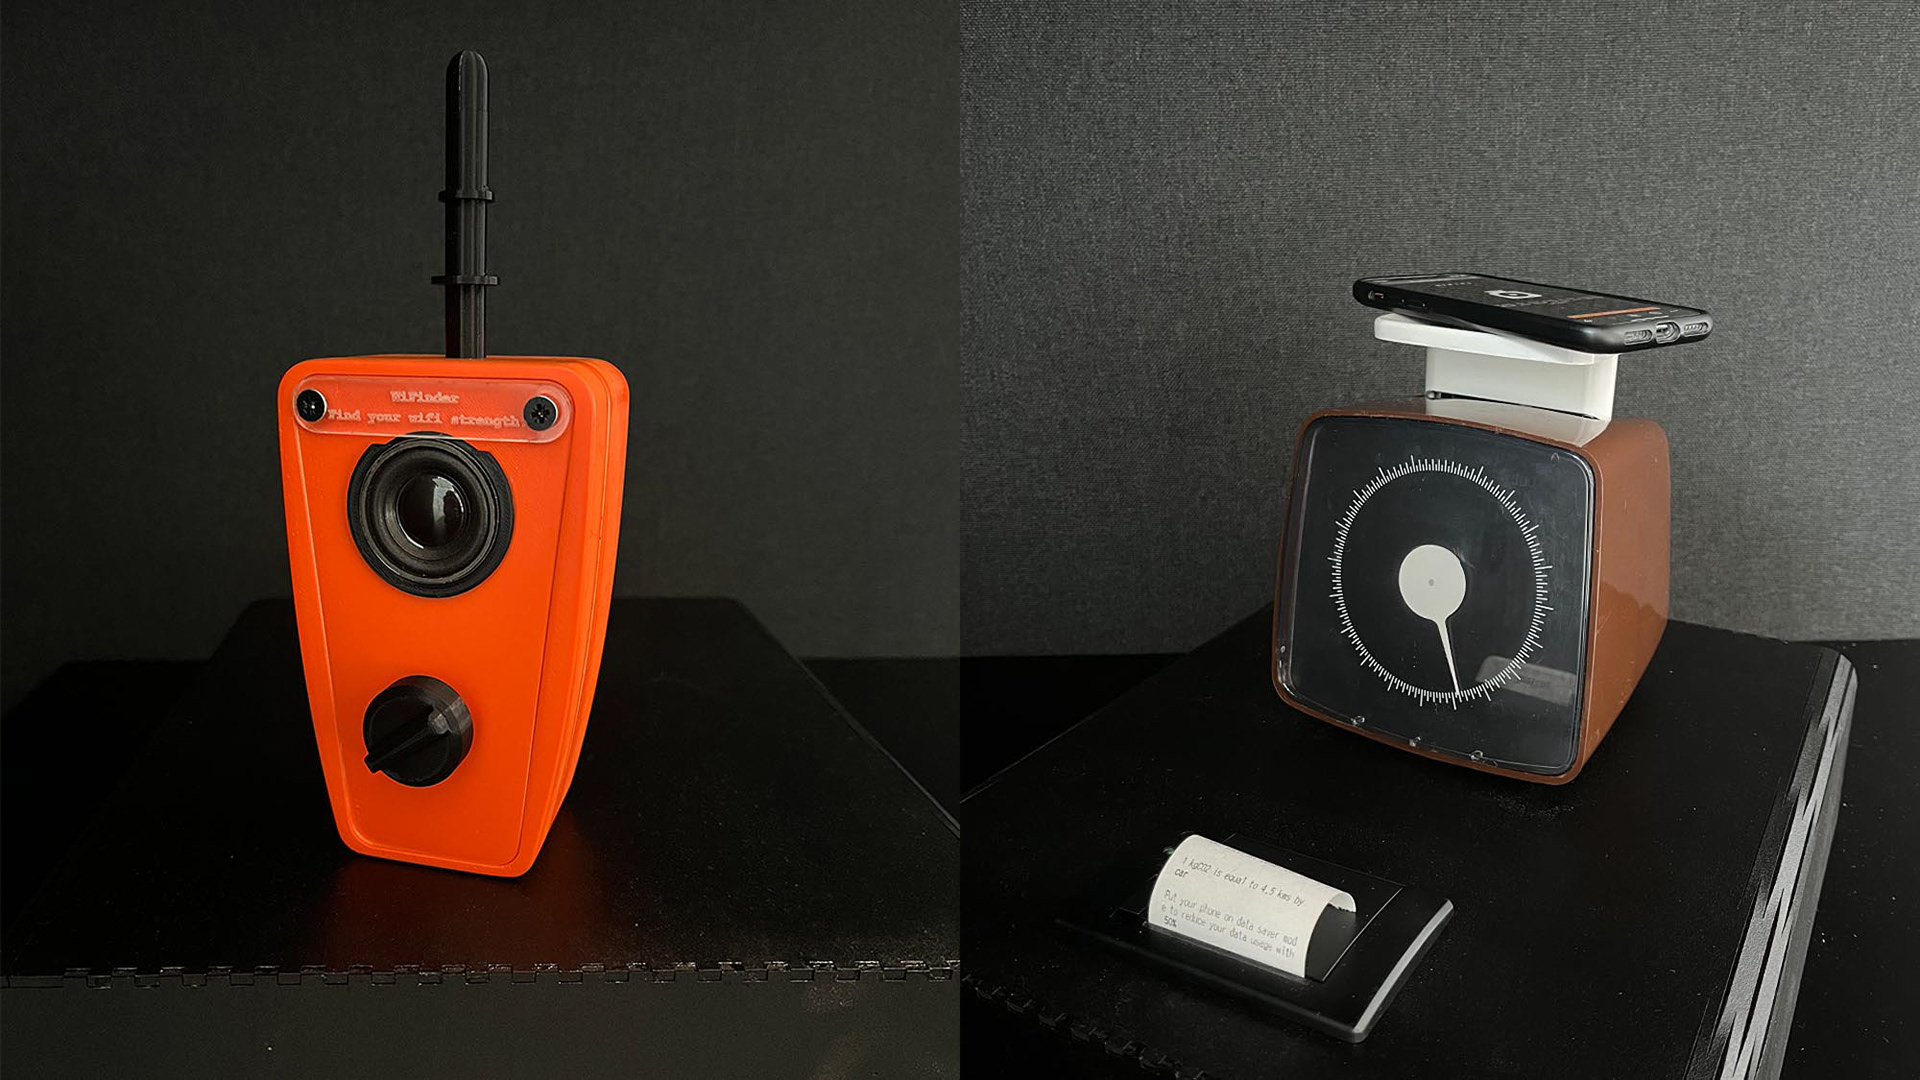
To enhance individuals' awareness of the data dynamics surrounding them during their exhibition visit, a device called "WiFinder" was created. This electronic instrument utilizes an Arduino Wi-Fi module to gauge Wi-Fi signal strength. By employing a speaker and a vibration motor, it conveys signal strength through pulsations to the user. The speaker emits a higher pitch, and the vibration motor intensifies its frequency in the presence of a stronger Wi-Fi signal. Conversely, as the Wi-Fi signal weakens, the speaker produces a lower pitch, and the motor slows down its vibrations. Users can adjust the volume using a rotating knob.
Through this innovative device, people gain a heightened awareness of the energy consumption associated with internet data transmission, allowing them to investigate the ebb and flow of data intensity in their surroundings.
My role in building this artefact has been coding and building the circuit to detect wifi strength and translate it to sound and vibration.
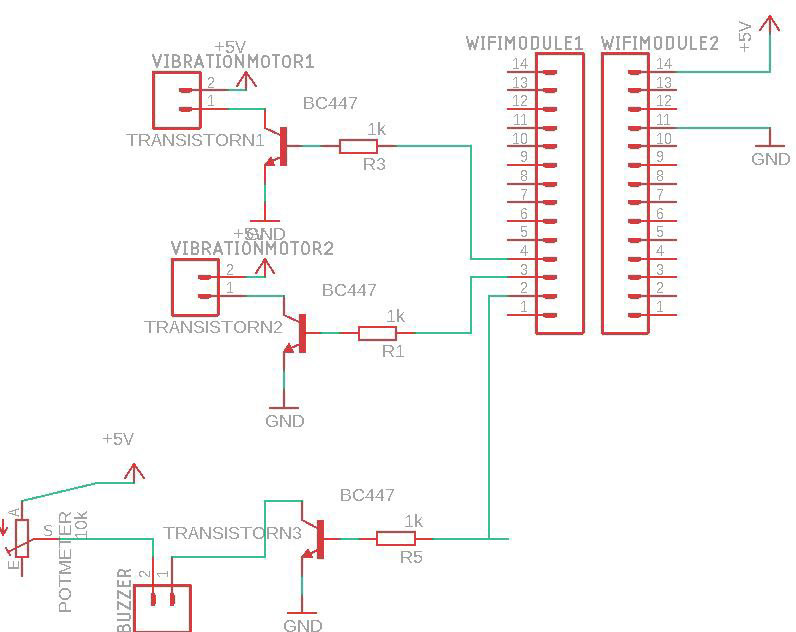

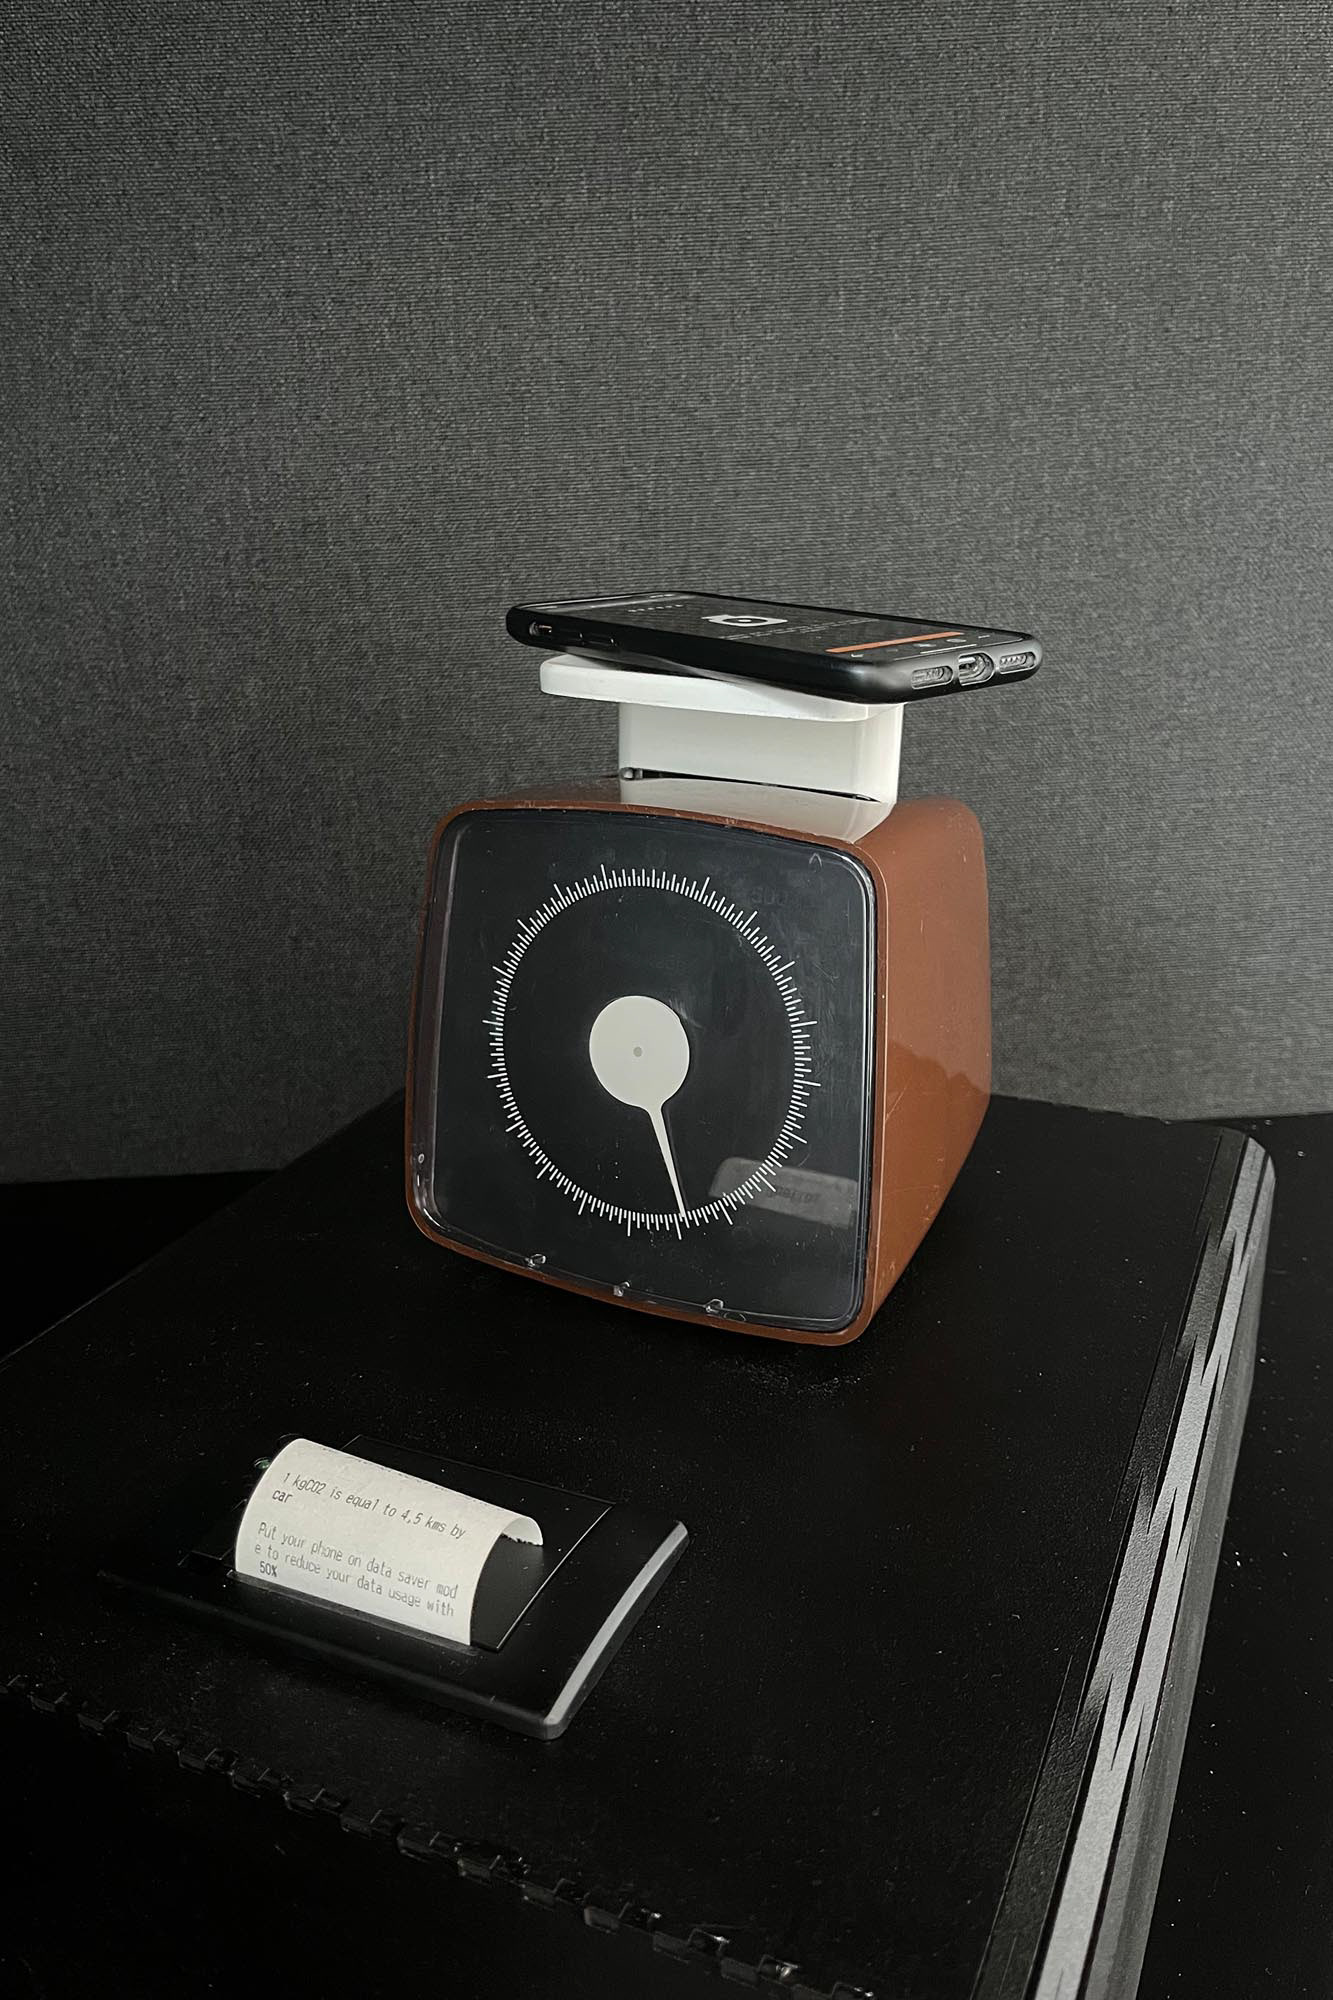
Exhibit 2 > Shop your data
To give the visitors a more personal experience with their data, a weight scale, thermal printer, and a website were combined into a third design. The website is an “online data shop” where people can buy their internet behaviour. Visitors first scan the QR code to go into the “online data shop”, where they will purchase their data for the next day. Visitors then add estimated usage time per website to the shopping cart. To make people associate CO2 emission with personal Internet usage, we developed a shopping website where the CO2 emissions of various websites every half hour are presented as the price. In Appendix D our calculations can be found. Going from MB to gCO2 has been done based on estimates by IEA (2021). The website redirects to a new page where users are instructed to place their mobile phones on the scale after clicking the "check out" button.
Exhibit 3 > Infographic
The front side of the poster gives people a brief introduction to the Internet infrastructure. It displays a world map with global data centre distribution and a storyboard to explain how the Internet functions when an Internet user watches a YouTube video in the Netherlands.

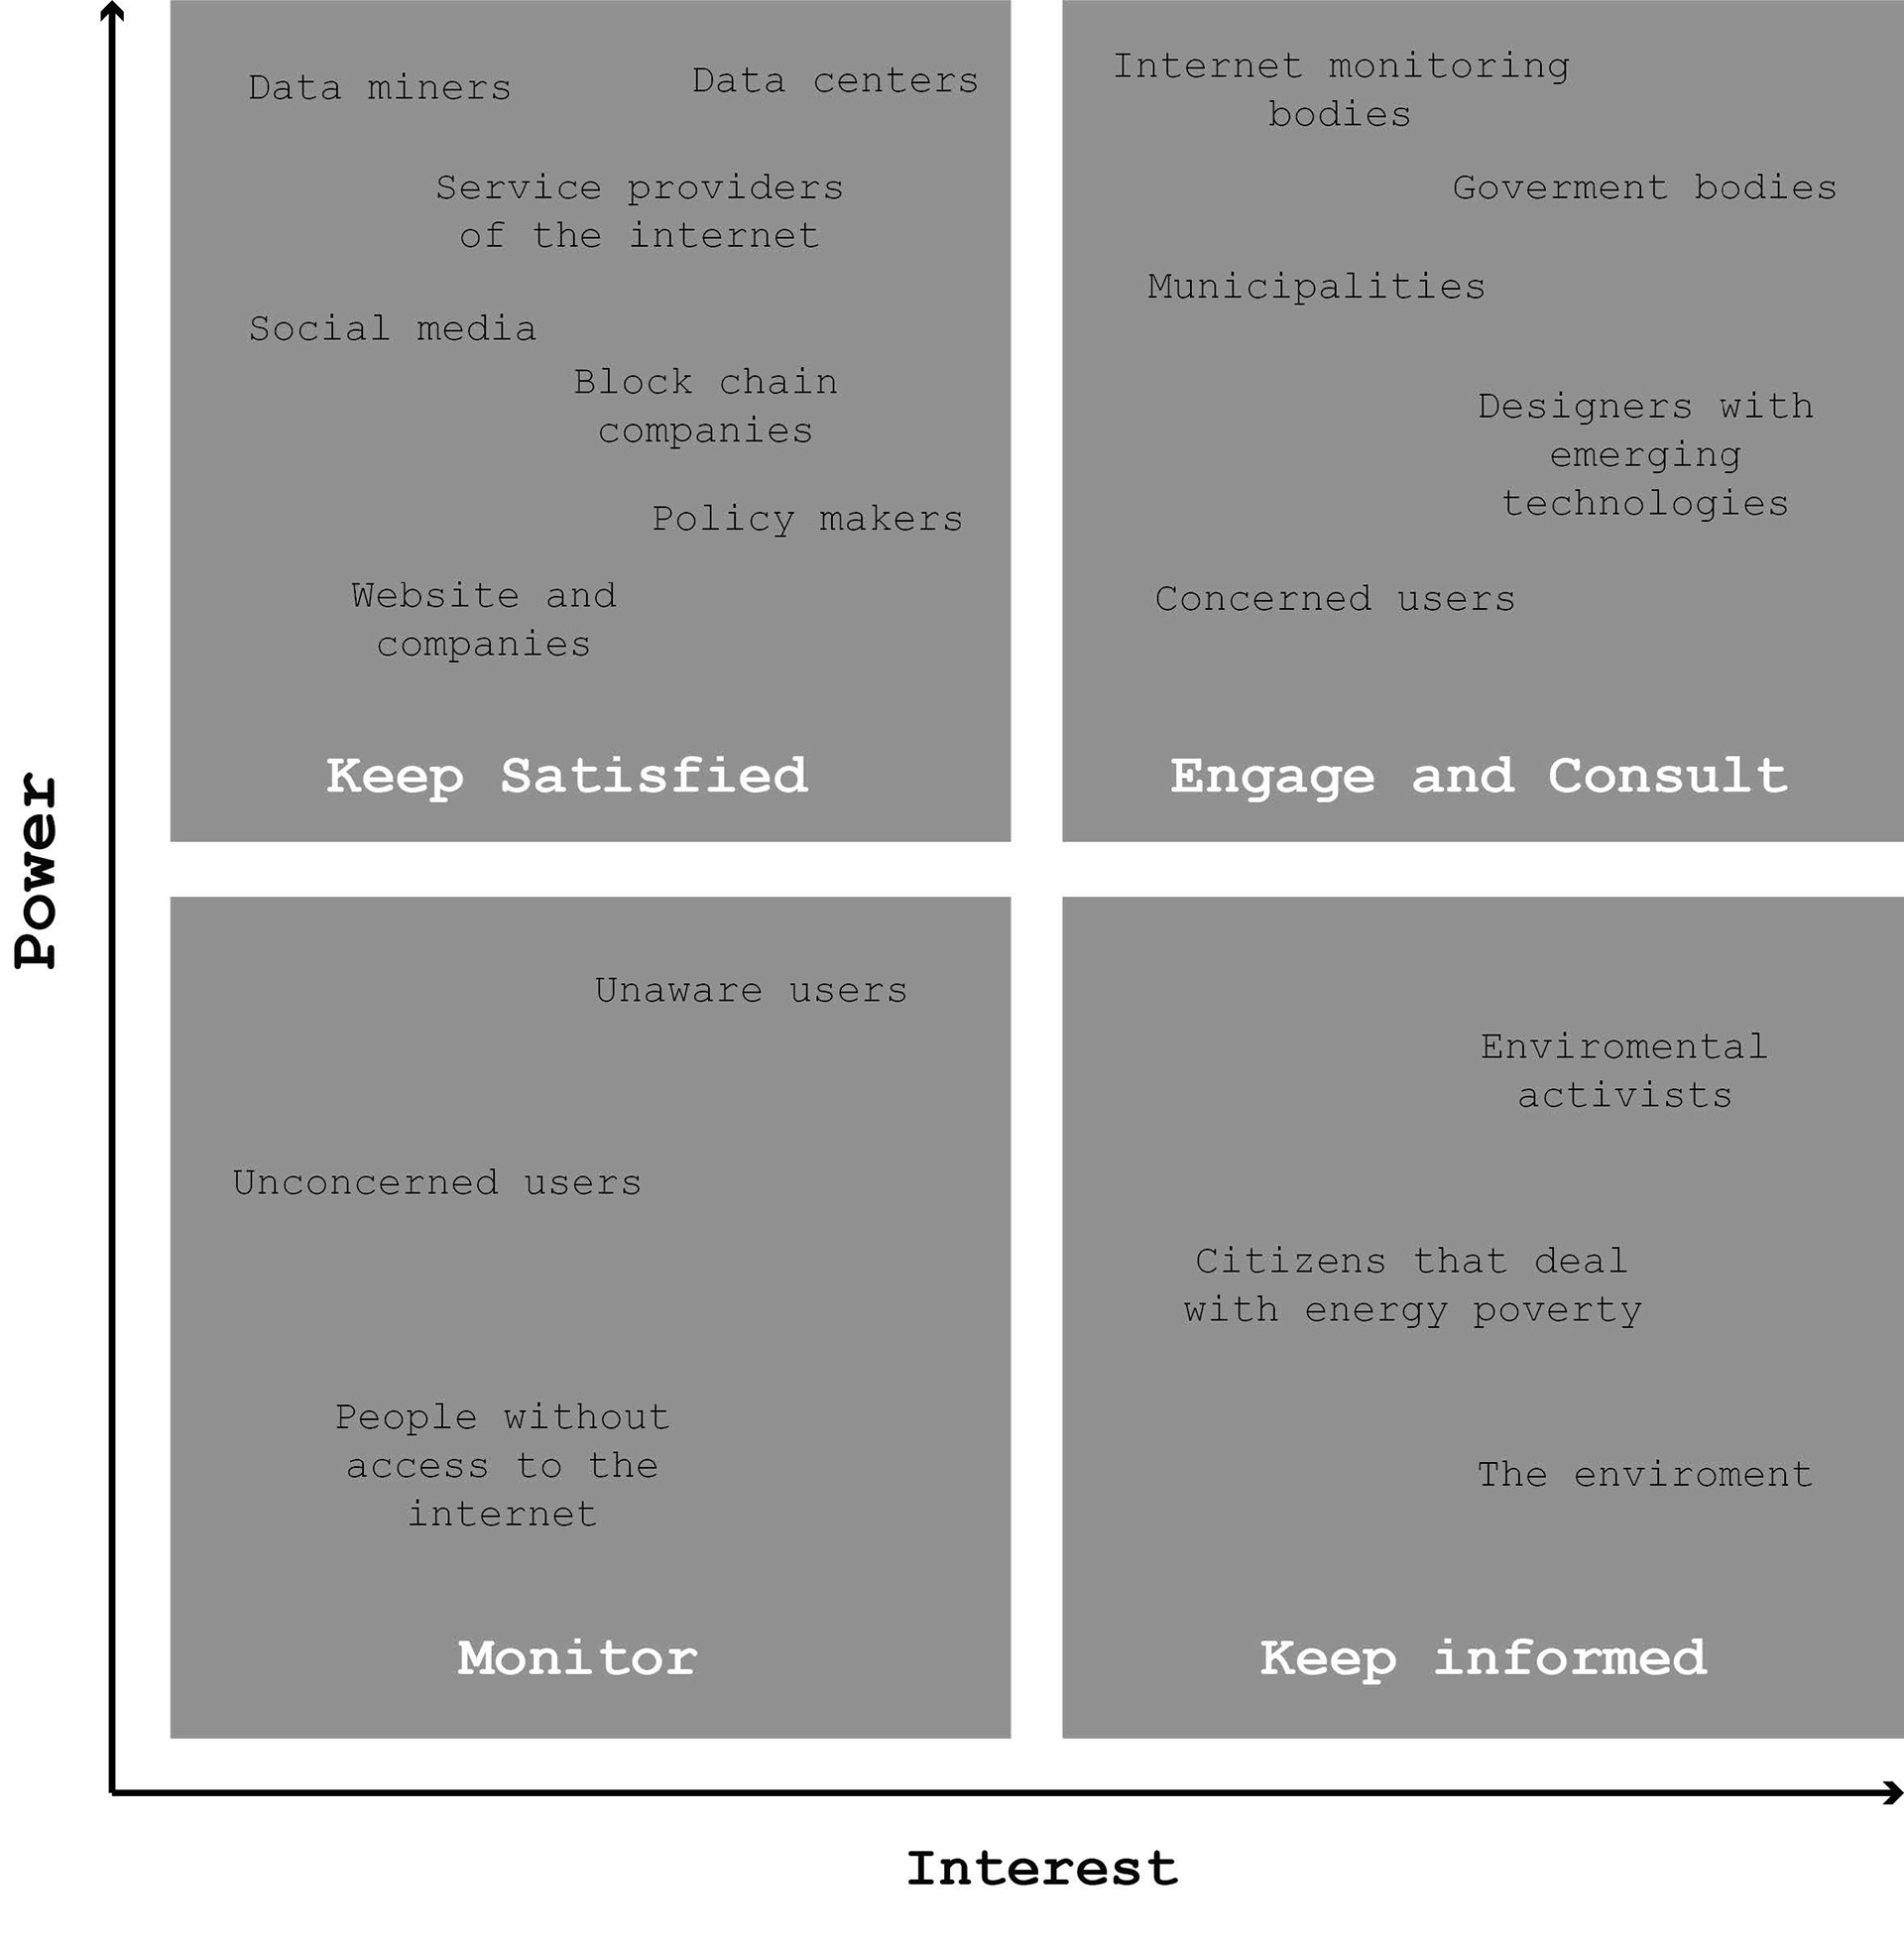
Stakeholder matrix to understand what stakeholders are contributing to unsustainable internet practices
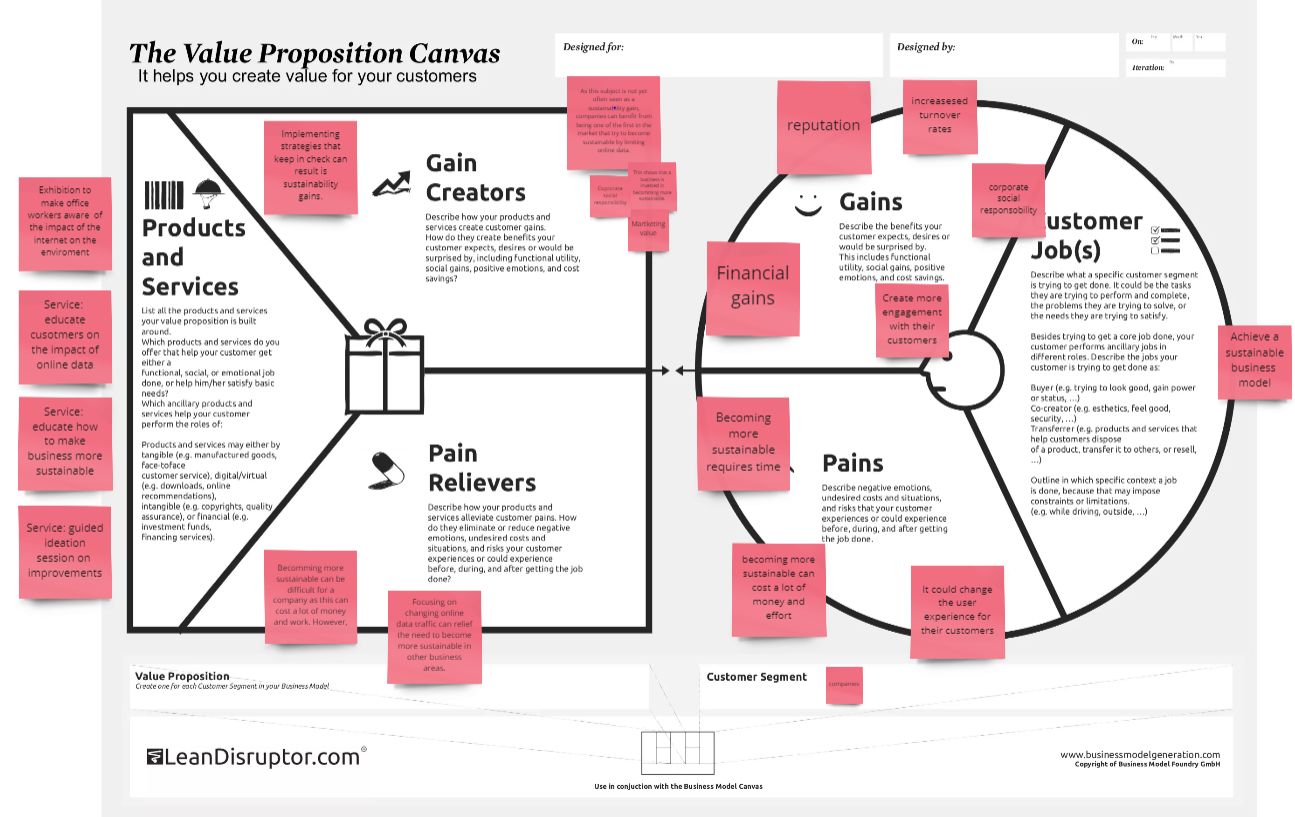
Defining strategy to help companies reduce internet usage
My contribution
Without going into too much detail, my contribution to the project has been designing and building the WiFinder, creating the style guide, and making sure the exhibition was tied together correctly. This not only improved my competence in MDC and TR, but allowed me to develop further my feel and understanding for aesthetics in general, as well as the aesthetics of interactions. Moreover, I played a central role in guiding the ideation sessions and made sure all team members were in line with the aim of the project, further developing my professional identity.